
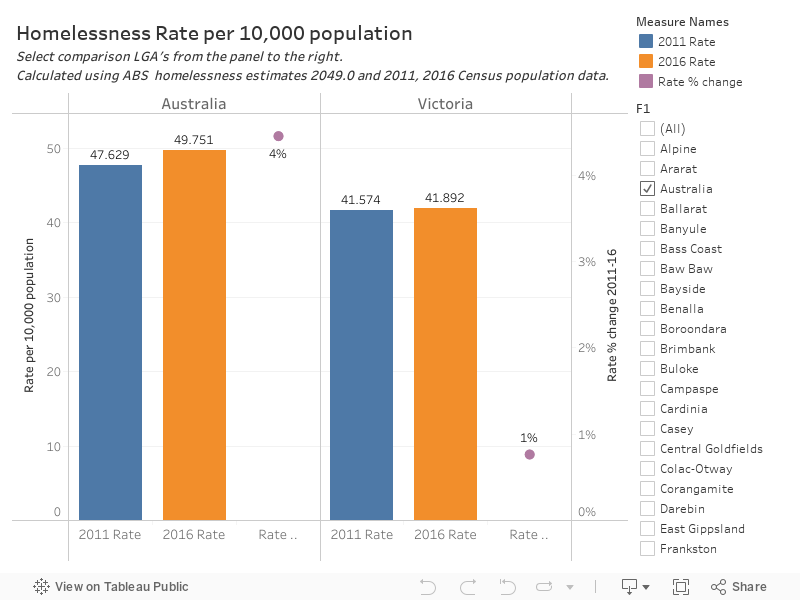
Last week Census released the 2016 homeless estimates (see knowledge base entry here). We have put together an interactive dashboard of the findings comparing 2011 and 2016 rate per 10,000 population by Victorian LGAs:
We have also set up this dashboard in excel format where you can select 2 Victorian LGAs for comparison. This Excel version presents the information in a way that is easy to print a snapshot for your region.
Click here to download: Homelessness by LGA 2016 (Excel file, 43kb)
The table below shows the homeless operational groups included in this count, and the proportion each contributes towards the overall homelessness figure Australia-wide.
|
|
2016 % |
|
Persons living in improvised dwellings, tents or sleeping out |
7% |
|
Persons in supported accommodation for the homeless |
18% |
|
Persons staying temporarily with other households |
15% |
|
Persons living in boarding houses |
15% |
|
Persons in other temporary lodging |
1% |
|
Persons living in ‘severely’ crowded dwellings |
44% |